
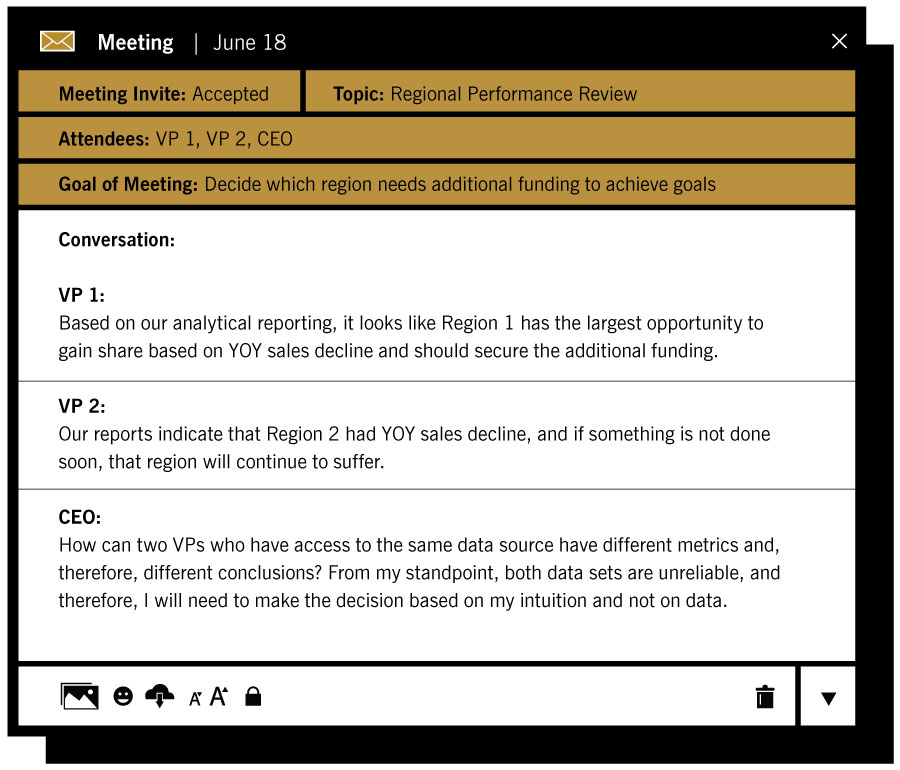
Does this frustrating story sound familiar? It permeates countless executive meetings in companies large and small. The problem is due to years of incorrect data-pulling techniques, inconsistent consolidations, and often-siloed analytical departments. Over time, it seems to be the executive who shouts the loudest or has pages of confusing data to back up his or her shouting who wins.
How can an organization reduce such frustrating meetings in the first place?
The gold standard answer is to develop an SVOT (single version of the truth) executive dashboard that gives a holistic view of business performance based on key performance indicators. SVOT dashboards align business activities to company vision and strategy and drive insightful action. The benefits of creating and distributing a balanced executive dashboard or scorecard are as follows:
1.Assess performance against goals and take insightful action. Executives can monitor performance and take the appropriate actions to either support a positive trend or make course corrections for negative trends.
2.Enhance communications. Dashboards are great communication vehicles to align on a company’s leading and lagging indicators and inspire employees throughout the organization.
3.Increase productivity. A well-built dashboard ensures that all important metrics are accessible in one place. It reduces duplication of siloed reports and improves communication between departments.
4. Boost performance. Dashboards allow companies to effectively drive collaboration for teams to work together to address performance challenges.
5. Improve profitability. Once teams are laser-focused on the key metrics, teams can spend appropriate energy and resources to improve bottom-line results.
Step One:
Align Leadership
The organization’s key leadership must be on board with the development of an SVOT executive dashboard. Executives need to align on the budget, timing, metrics, visualizations, and, ultimately, audiences that will drive activities using the dashboard. To further align the facilitation of leadership in building the dashboard, it is best to appoint a single empowered business lead to shepherd the effort and gain organizational alignment. This resource will then communicate and secure both internal and potentially external resources to continue the effort through a formal project.Step Two:
Metrics, Metrics, Metrics
The lead must unite executives around the appropriate metrics to gauge success across each level of the organization. Best practice recommends beginning with the annual company goals as a foundation and then measurements for each executive team member and his or her respective teams. Workshops need to be organized to review team goals and metrics that often uncover conflicting performance measures. This is a perfect opportunity for realignment. The leadership team can then list specific desired metrics over specific timelines. For instance, certain types of strategic actions can take several years to move metrics, while other more tactical actions can drive immediate results.
Overall, a set of goals needs to be identified as the heart of the executive dashboard, and each metric to be measured should be SMART (specific, measurable, achievable, realistic, and time-based). Once a robust list of the potential dashboard metrics is captured, the lead should conduct a prioritization exercise. The goal of the exercise is to reduce the number of metrics to, ideally, between seven and 10. The dashboard should include a balance of leading and lagging indicators and cover the individual lines of business and corresponding key drivers.
Step Three:
Identify the Visualization Tool
Once the list of metrics is established, the next step is to develop a list of visualization options. Depending on the budget, options can range from simple Microsoft Excel spreadsheets to attractive off-the-shelf dashboarding software. Each metric needs to be defined with a visually appealing interface with the appropriate color and fonts. Visualization options also go beyond typical charts to include graphical options, such as speedometers, area and line charts, XY plots, pivot tables, and interactive graphs. Thresholds can also be included on each visualization to depict whether a metric is meeting, exceeding, or behind a certain target goal. Visualization of the dashboard is key to ensuring that the dashboard is easy to read and simple to comprehend.
Step Four:
Mock-Up, Sign-Off, and Production
Next, develop a mock-up of the dashboard. To develop the optimal dashboard mock-up, the data source for each selected metric needs to be identified, and often, IT resources need to be involved to help. If calculations are required for a metric, an SVOT approach should be utilized with broad consensus on the use of the formula and the interpretation of the result. For instance, calculating the average of a list of values using a weighted average versus a straight-line average can result in a vast difference in interpretation and action. Once the mock-up has been developed, share it with key stakeholders for review and further refinement based on feedback. During the mock-up phase, the lead also should identify the resources necessary to move the mock-up into a production environment and be able to assemble and distribute the dashboard on the agreed timeline.
Step Five:
Implement a Governance Process
The final step is to ensure the dashboard is used. The lead should set up a regular cadence with executives to review the dashboard, identify actions, prioritize, and hold everyone accountable to previous actions promised. Without a governance process, your dashboard will sit on a shelf and rarely be looked at after the initial launch.Remember, a balanced executive dashboard will ultimately help your organization ensure that what you are tracking and acting on is aligned with the organization’s goals, improves communication, accelerates productivity, strengthens performance, and ultimately boosts profitability. But this takes work. Your leadership must agree on key metrics and visualizations, drive actions with their teams using the dashboard, and be held accountable. Once your dashboard is up and running, of course, your greatest benefit will be a reduction of frustrating meetings and shouting matches between your executives.