
Are you doing business cases only for large projects? Do you find yourself breaking up projects to avoid doing a business case? Is this happening because you’re not getting good outcomes in your ROI analysis? Or perhaps your Agile technology group is pressing for smaller projects that don’t seem to warrant a full business case.
In this article we are going to explore some common pitfalls and establish some basic guidelines for a repeatable business case process that should produce consistent, dependable ROI projection results, so that you can make better, more informed decisions about your project portfolio.
First, let’s define some terms. When we talk about a project, we mean any set of coordinated activities that is not business as usual, in which there is some sort of significant change occurring in an organization. Examples include introducing a new product to market, upgrading your accounting platform, and automating your invoicing process. A project has a measurable dollar investment (costs) and expected value (benefits), which can be totally tangible, partially tangible, or completely intangible.
The ROI projection analysis is a simple calculation that attempts to predict the return on the investment. It is the centerpiece of a business case narrative.
We have assembled a set of ROI rules followed by a brief overview of an ROI framework that contains some innovative practices.
Rule No. 1: Always do a business case
Virtually every project needs a business case or, at least, an ROI analysis. Why invest the money and time if you can’t assess the business benefit or outcome, if you haven’t done at least some measure of due diligence? Resist the temptation to set artificial thresholds (say, $1 million) to qualify for a business case.
The unintended consequence is the scenario we offered at the outset: the tendency to split up big projects, so they fall below the threshold. Without a business case, the project team doesn’t know which benefits are important, which means they can’t retool the effort while in flight to account for cost overruns or delays.
Rule No. 2: Stay humble with your estimates
Did you ever see an ROI projection like this?
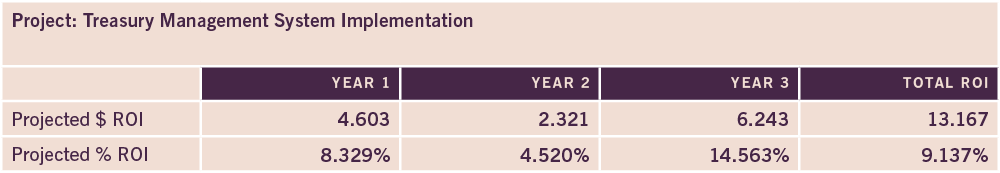
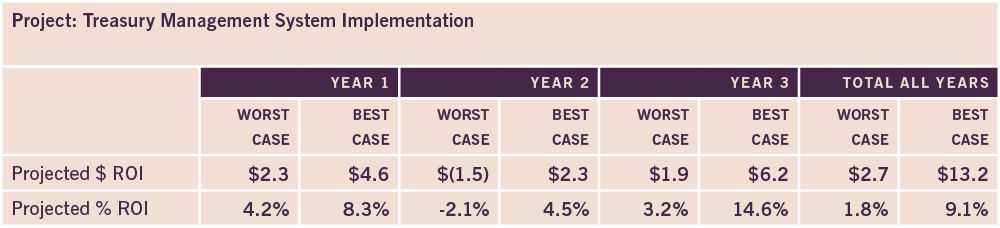
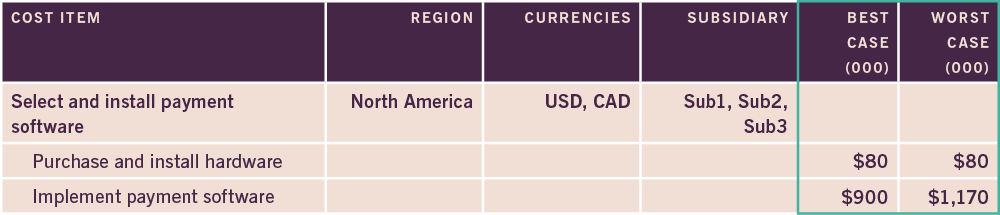
There are two flaws in this table. First, the precision suggests far too much confidence in the estimation. Second, it’s not showing the best-case and worst-case scenarios. The BC/WC will demonstrate to stakeholders that you have done your due diligence and, at least, some risk assessment. Later, we’ll explore some techniques to quantify risk measures, so we can produce a more confident set of projections that looks more like this:
Rule No. 3: The ROI is not just a pre-project exercise
If you want to continuously improve your project’s trajectory and improve your subsequent projects, it is critical to keep the ROI analysis up to date and to review your estimates after the project’s completion. Were your cost estimate assumptions realistic? Could you have done a better job quantifying seemingly intangible benefits?
Rule No. 4: Distinguish intangible from tangible benefits
Many projects have both tangible and intangible benefits. Intangible benefits will generally inflate your ROI. It is important to make a strong effort to flag each benefit’s degree of tangibility. We will show how to use this measure in a risk scorecard to describe how speculative your project is.
Rule No. 5: Every project must have benefits
There is a temptation to split up a project between costs and benefits. You can’t measure ROI with only one or the other. It would be wrong to say, “Let’s get the infrastructure remake out of the way before we can even think about making those widgets.” The size, scope, and cadence of the infrastructure part will be informed by the value of the new widgets project.
Rule No. 6: Link benefits to costs
This may seem obvious, but you would be surprised how often this is overlooked. Linking benefits and costs has a big effect on the project cadence and the capital expenditure. Let’s say, for example, you are automating your payment method as part of a larger accounting system overhaul. If you don’t align your staff reduction with the payment module components, the ROI could be delayed. You push out your break-even and threaten to miss your hurdle rate—the ROI rate your organization requires to green-light a project.
Rule No. 7: Evaluate the BC/WC spread against your risk appetite
The best case/worst case spread (risk score) should make you think about your risk appetite and could alter the early-stage activities. Consider, for example, a telecom company that is contemplating a switch from 4G to 5G chipsets. The massive plant retooling cost and the uncertainty about the timing for market adoption can produce very wide BC/WC spreads, increasing your project risk.
Rule No. 8: Your costs and benefits must feed your project plan
Should you decide to move forward on a given project, the costs defined in your ROI analysis should become high-level activities in your project plan. The benefits should become your major project milestones. In our telecom example, the chipset design is one of the costs; an anticipated 30 percent increase in market share is a project outcome milestone (there are other types of milestones).
Any new or revised costs you uncover during execution should reflect back on your ROI analysis. For example, suppose your chip design cost comes in at 10 times your original estimate, delaying the projected product rollout, threatening your market-share increase, and slamming your overall ROI. Does it pay to continue the project or should you cut your losses?
Rule No. 9: There are very few truly new projects
If you go back and examine the last 20 projects, some consistent patterns will emerge (assuming you keep good records of estimates versus actuals):
- Similar or identical cost and benefit items appear (maybe worded slightly differently across projects).
- You make the same estimation mistakes repeatedly.
- You missed substantial cost items.
- There are unintended consequences of a project that may have an indirect cost (such as a big layoff that affects morale, which in turn can hurt productivity).
Imagine a project risk model that enables your ROI analysts to learn from their mistakes and infuses this knowledge into the organization’s DNA. This technique will not only improve your ROI projections but will also streamline the entire process of business case creation. In the framework section of this article, we’ll touch on some risk model creation techniques.
Rule No. 10: Complex and long-term projects require multiple reporting dimensions
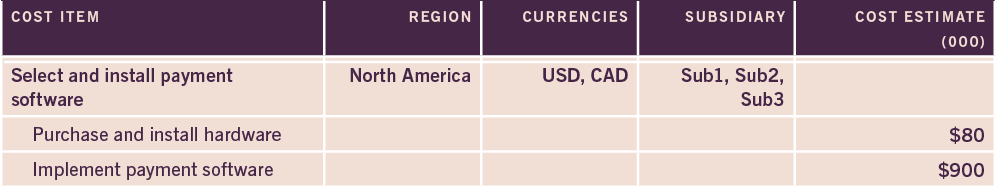
It’s tempting to create a business case across a single dimension because it’s easier and faster. Complex and long projects usually deserve a deeper perspective, which enables a varied what-if analysis. Better ROI tools can use this approach to optimize hurdle-rate and break-even-rate analysis. In this ROI excerpt, a large multinational insurance company is consolidating its vendor and customer payments onto a single platform across three regions, six subsidiaries, and 10 currencies.
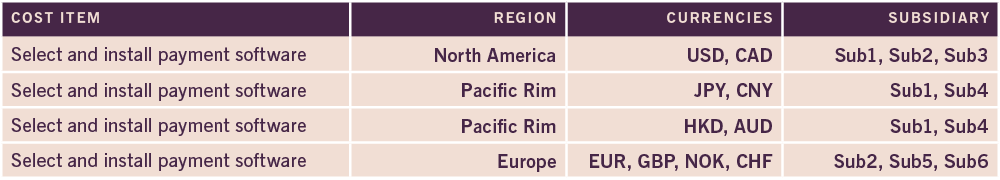
A single cost item is repeated multiple times for groupings by region, currency, and subsidiary. This could be driven by business constraints (e.g., the Japanese and Chinese markets are larger and more complex) or by a desire to meet a hurdle rate earlier in the cycle for revenue recognition purposes.
The ROI Framework
This framework satisfies very important—and very difficult—requirements for projecting ROI.
Stage 1: Preliminary work
Define a hurdle rate:
A hurdle rate is a division-wide or company-wide ROI return rate all projects must reach. Some companies may also stipulate a duration guideline; that is, the hurdle rate must be achieved within two years. You may have different hurdle rates for different types of projects. For example, a speculative project like a new product launch, which has higher risk, may have a much higher hurdle rate than a routine automation project.
Delivery dates:
Establish a hoped-for delivery date for each major benefit milestone. This is only a guide, helping to split cost activities that drive toward each milestone. For example, in Rule 10, we had a benefit to standardize payment processing in the Pacific Rim. To realize the Japanese and Chinese installations first, we split these two cost activities.
Reporting dimensions:
As described in Rule 10, we frequently (but not always) need extra reporting dimensions. We can adjust these later, but in the planning stage, it is helpful to consider these early before we start the main task of estimating.
Stakeholders:
Identify stakeholders who will provide the cost and benefit estimates in the next stage.
Stage 2: Estimation metrics
Obtain estimates:
Step one in the estimation process is to obtain the cost and benefit estimates from the stakeholders. In addition to the dollar amount, we need a duration of the cost item so we can (in stages three and four) perform year-over-year calculations and reporting and project in which period the benefits will appear. This will also enable us to perform a what-if analysis and optimization (stage 3).
Best case/worst case:
The fun part of this exercise is how to assess BC/WC. We introduce here a new concept called the “confidence factor” analysis based on a risk model. If you want to make this a streamlined, rapid process, you have to bite the bullet and spend some time setting up your risk database.
As we started to see in Rule 2 and Rule 9, there are common patterns across many of your projects. Now is the time to enter those common items in a database and assign risk factors.
In this excerpt from a risk database, the analyst is assessing the quality of a cost estimate provided by the payment software vendor (from Rule 10). It’s possible your vendor took into account some of these factors. In that case, you would skip these questions. Your confidence factor begins at one and is adjusted for each bad answer.
If you want to make this a streamlined, rapid process, you have to bite the bullet and spend some time setting up your risk database.
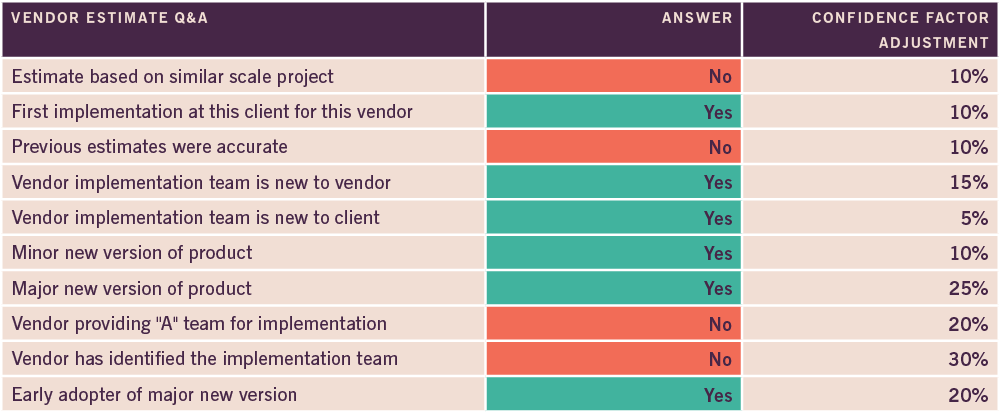
Let’s say your vendor estimated $900,000 for the implementation.
But the vendor responded “yes” to “major new version of the product” (25%) and “vendor implementation team is new to client” (5%). That would be a 30% (25%+5%) adjustment to your confidence factor.
Applying confidence factors:
Applying confidence factors may result in very wide ROI spreads. We will explore techniques to reduce these spreads in a subsequent article.
We have focused on the cost side of the ROI equation, but comparable confidence factor analysis pertains to the benefit side as well. This is especially true when estimating intangible benefits. Let’s say you are estimating an offshoring project that has a projected two percent leave-behind staff. How confident are you with the two percent figure? Do you have any metrics for similar projects? Maybe some other part of the company has done an offshoring project? The 98 percent staff reduction may end up being closer to 95 percent, or may be phased in gradually over several years.
Assess benefit tangibility:
An important marker for the project business case review (especially when comparing the project to others in a portfolio of projects) is the level of benefit tangibility. In the calculation stage we will use the total benefit tangibility percentage to inform the speculation risk score. Here are some examples of tangibility estimates. Consider setting up risk items for these estimates as well.
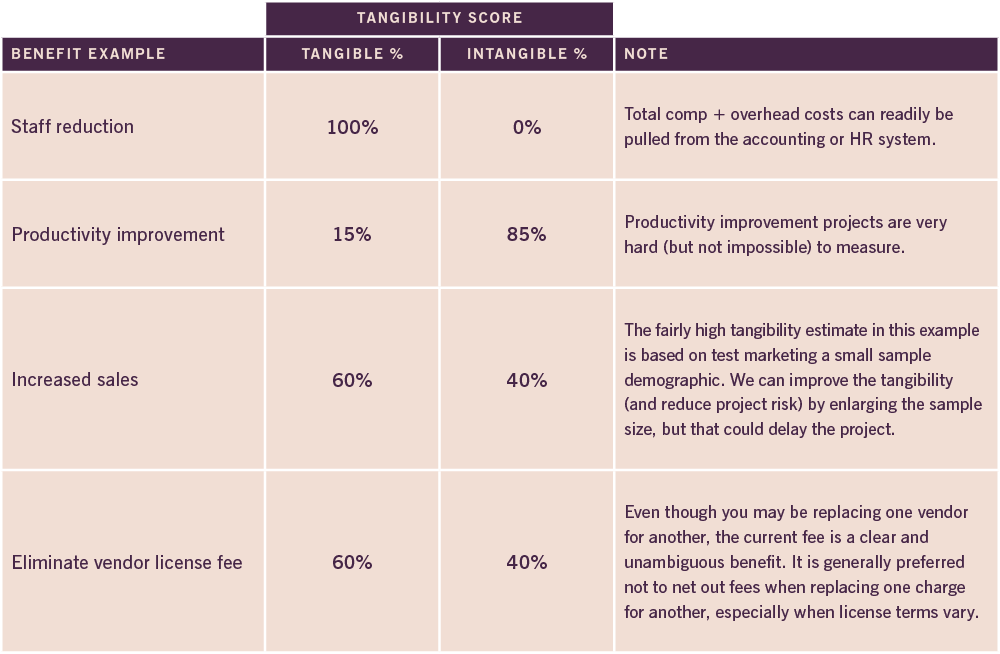
Defining your benefits correctly is critical for tangibility analysis and for ROI projection. The more directly the benefit can trace to a top-line or bottom-line improvement, the more tangible it is, and the better the risk score. The benefit “All staff PCs will be on the same version of Windows” is not a true benefit; but “Reduce tech support staff by 10 percent” is readily quantifiable, although it may not be 100 percent tangible.

Stage 3: Calculation
In the calculation stage we perform all the calculations for each year broken out for each reporting dimension.
- ROI amount total for best-case and worst-case scenarios
- Time to break even
- Time to reach the hurdle rate
- Risk scorecard
Back to the consolidated payments example from Rule 10, here is a basic ROI BC/WC calculation showing only the time reporting dimension
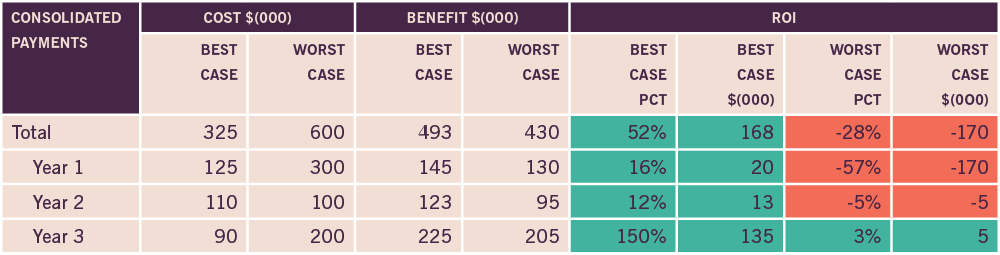
The best case shows a positive ROI throughout the project, whereas the worst case doesn’t break even until year three.
Benefits tangibility:
Now let’s examine the benefits tangibility and how it reflects on the risk scorecard.
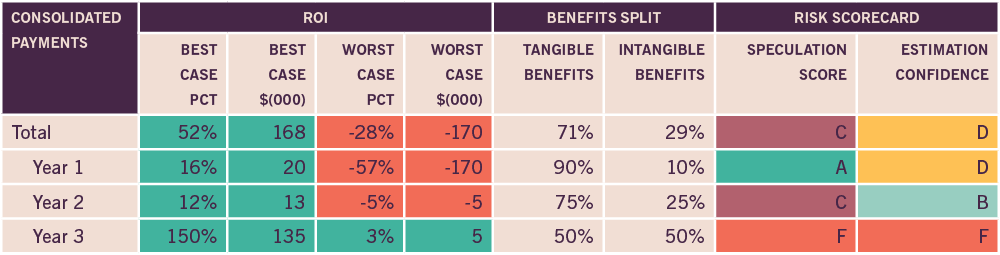
As discussed earlier, the benefits tangibility metric indicates how well you understand the benefits of your project. It is most definitely an inexact science. In our consolidated payments project, we are rolling out North America first. Because we are based in North America, we understand the regulatory landscape well. However, Europe and the Pacific Rim, which are slated for years two and three, have far greater challenges in their respective labor markets. Hence, the benefit is more speculative, leading to a lower risk grade. Those two regions pull down the overall risk score for the project.
Estimation confidence:
The estimation confidence grade represents the spread between best-case and worst-case ROI.
In this example, the overall project spread is very wide, yielding a “D” score. We will review what these scores mean and describe some actions in the next stage.
Stage 4: Analysis
The ROI framework is far more useful as a tool to provide oversight into an entire portfolio of projects, given the natural limitation of resources (capital expense and staff) for a department or a company. The metrics presented in the previous stage allow a comparison of both risk and value. A high-risk, speculative project may be worthwhile if the capital expense is modest. Poor risk scores may trigger the management team to press the ROI team to perform more due diligence or reframe the project to change the risk profile. Here are some ways of analyzing the results and some potential actions.
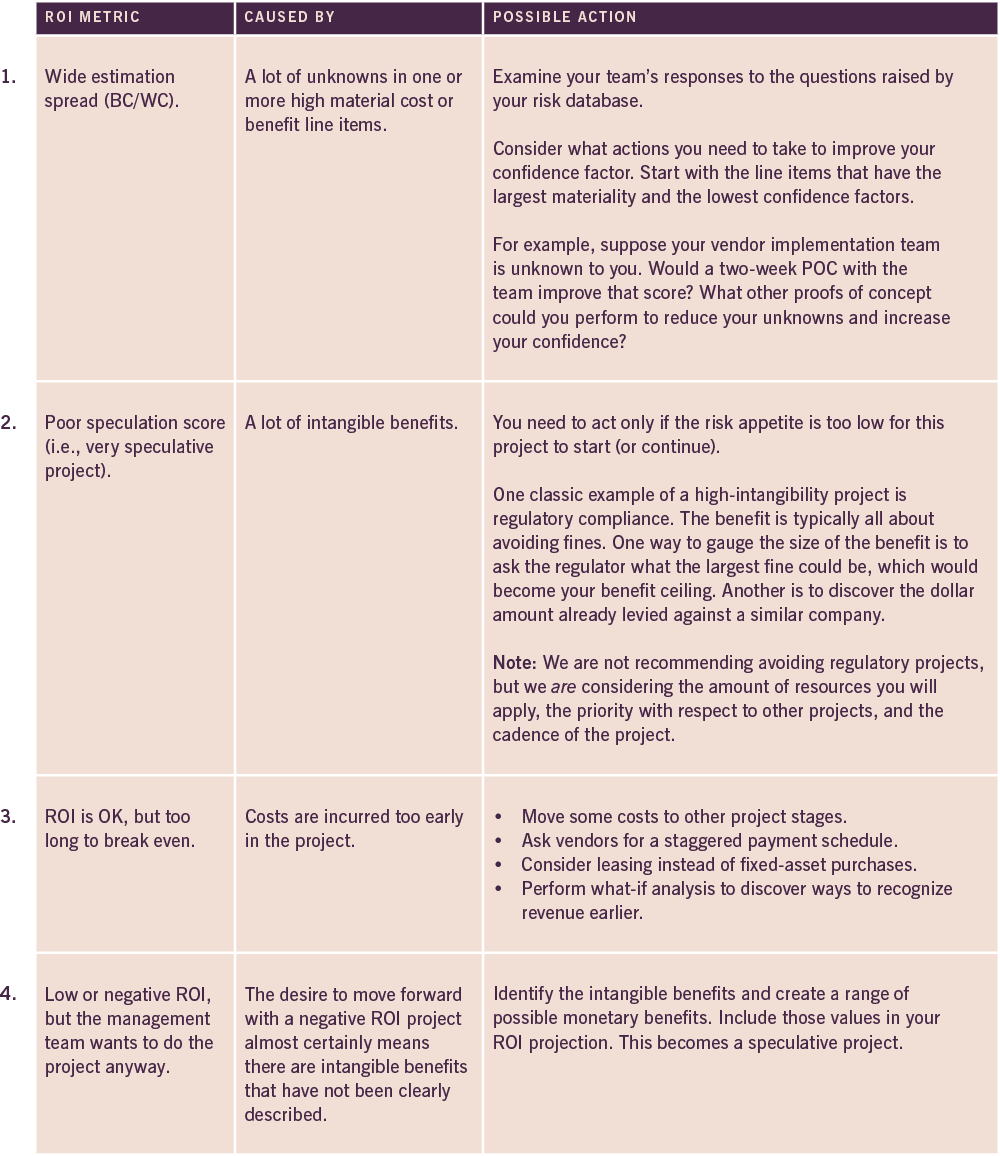
In order to perform most of these troubleshooting actions, your analysis reporting tool must be able to perform two sophisticated functions:
Drilling down:
Moving from high-level totals into the detail cost and benefit items.
Optimization:
This is best performed by establishing a target (say, a “B” score for estimation confidence) and letting the tool report on line items that require further due diligence to improve the score.
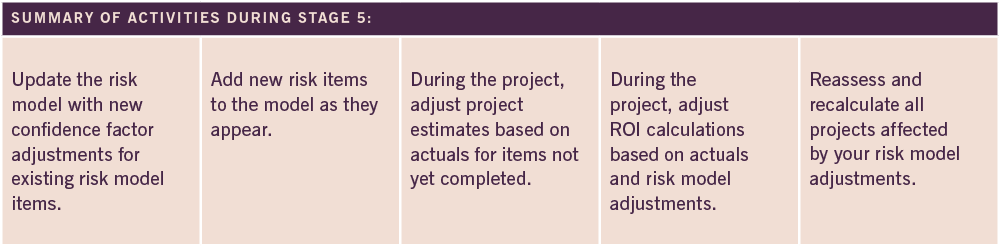
Stage 5: Execution and post-execution
An objective of this framework was a repeatable process that improves accuracy and speed over time. To do this effectively, you need to adjust the risk model (if you have one) by adding new risk entries as they turn up (surprises) and by adjusting existing risk entries based on actual costs during the project and after it is completed.
As we touched on in Rule 3, doing this during the project is critical if you want to continuously reassess whether to continue the project and also to adjust the project vectors. Because the same risk model is (hopefully) used for all your projects, any adjustments you make to the model should trigger estimate recalculation for other affected projects.
It is not a simple matter to build out a working project risk model. One technique is to examine past projects and look for common patterns where estimates proved inaccurate. Then reflect on the unknown factors and surprises that crept into the project.
Conclusions
In this article we examined some classic techniques for ROI analysis mingled with some new concepts for assessing and refining your ROI techniques: the confidence factors, the risk model and scorecard, and tangibility measures. We hope some of these concepts will help you create more accurate business cases and streamline the overall decision-making and planning process.