
When you look at those colorful executive-level dashboards that you probably paid consultants several thousand dollars to make, have you caught yourself asking, “Am I able to use these to make decisions that:
- Generate more revenue;
- Gain market share;
- Increase customer value;
- Proactively identify trends?”
If your dashboards are not helping you easily answer those questions, then it’s time to shift the focus from figuring out how to best present your data to instead determining what information you need.
Over the past few years, “data visualization” and “better decision-making” have become two seemingly inseparable concepts, so much so that, according to a 2017 Gartner study, the worldwide business intelligence (BI) and analytics market was expected to grow to $22.8 billion by this year. With businesses across the world allocating an average of 37 percent of their IT spend to BI,1 how do they ensure they are seeing a return on their investments?
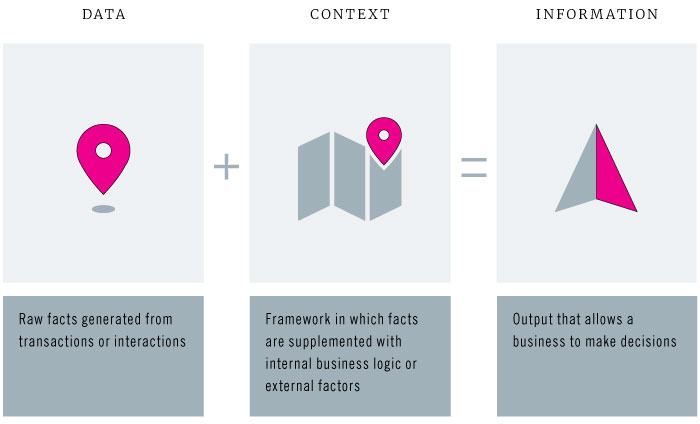
At Jabian, we believe that to make the most of your visualization tools, you should view data-driven decision-making as a simple equation: Data + Context = Information. Throughout this article, we will aim to demonstrate the impact this philosophy can have on your organization’s ability to make decisions by following a real-life example at each component of the equation.
Data: Gathering foundational facts
Data is defined as “factual information (such as measurements or statistics) used as a basis for reasoning, discussion, or calculation.”2 Data in the business world is just that: raw facts captured and stored as a basis on which decisions can be made. But how is data used only as a “basis” for decision-making? You may think that since your organization is collecting enormous amounts of data through human interactions, digital interactions, transactions, and other avenues, you are prepared to leverage advanced business intelligence tools to optimize decision-making.
But there are a few more steps that organizations must take to increase the validity of the data displayed within the fancy BI tools. Collecting, documenting, and storing raw data points is the first step in the equation but could lead to disastrous decisions if not put into proper context.
Context:Understanding the circumstances
As your grade school literature teacher likely taught you, a story is more impactful when context—such as location, timing, characters, and feelings—is provided. Data is no different. End users of data need to understand the who, what, where, and when of the data that is being used. These contextual elements will inform users about the domains to which the data applies, what type of data it is, from where the data is sourced, how the data is transformed and used throughout the organization, etc. Even the smallest differences in these contextual elements can completely change how the data is interpreted.
Information:Gaining knowledge
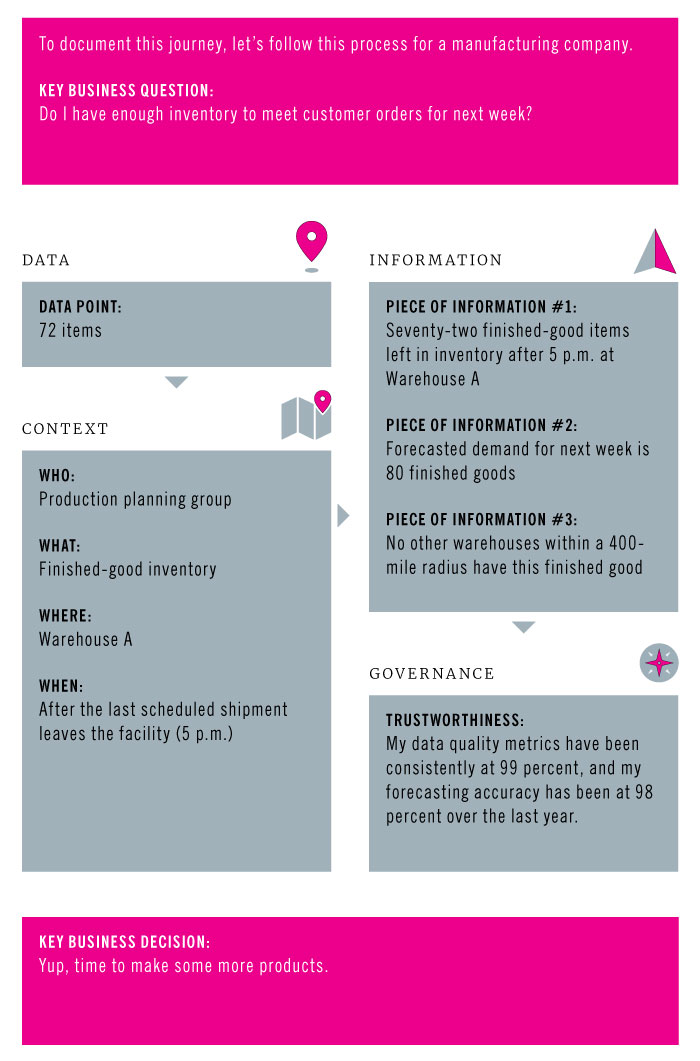
Just like in a book, having additional context around characters helps you to understand the reasons for their behaviors, start to develop opinions about them, and guess at their next actions. Having context around your data, ultimately creating a piece of information, allows you to begin to formulate a cohesive picture. However, a single piece of information is seldom enough to answer our user’s question. In our example, if leadership’s question is “Do I have enough inventory to meet customer orders for next week?” our information of “Seventy-two finished good items left in inventory after 5 p.m. at Warehouse A” would not suffice.
The real power of information comes when multiple pieces of information are combined. Understanding the question and identifying the appropriate sets of information required to answer that question will allow organizations to combine appropriate data and context to drive decisions.
Data Governance:Turning information into actionable insights
A lot of organizations feel like once they have information, they are done with data, but according to an Experian data quality study, “the average company loses 12 percent of its revenue because of inaccurate data.”3 What if having more trustworthy information could reduce that number by 5 percent? Now you may have met your target numbers for the second quarter.
So how do you increase the reliability of your information? Make data governance a priority for your organization. Governance is the strategy and process by which data is monitored and controlled. This can include aligning on definitions of key data sets, identifying individuals to own those sets, monitoring quality, implementing user access controls, defining and aligning on metrics, etc. Just like with any new capability, there are levels of maturity for such an organization, and it is up to you to define what the best level is for your business. But even just the smallest amount of governance can turn basic information into trusted and actionable insights.
Where to start?
While we presented the equation to you from left to right, the best place to start to define what data and context you need is by identifying what information you are looking to glean. Going from right to left targeting the appropriate information will ensure that all business units in the organization are not only involved, but also feel accountable and no longer see data as “an IT problem.” Still, rather than focusing on how you will consume the information (i.e., BI tools), really spend time understanding what metrics drive your business and your organization’s value to best understand how to build the rest of your equation. Once your information equation is stable, your dashboards are able to more effectively and confidently answer those critical questions for running and growing your business.