
However, for the “statheads” — those who believe in APBRmetrics, basketball’s sabermetrics, or advanced analytics — or for members of team operations departments, the game goes beyond what’s visible on the court. It becomes a landscape on which the underlying numbers, data, and metrics can be transformed into knowledge that can decide an argument, a bet, or even an entire season.
The amount of data available in basketball has seemingly exploded overnight, just as it has in the business world. Teams that have used that information effectively have performed very well over the last few years. How have basketball teams approached using this data, and how can their strategy apply to a business?
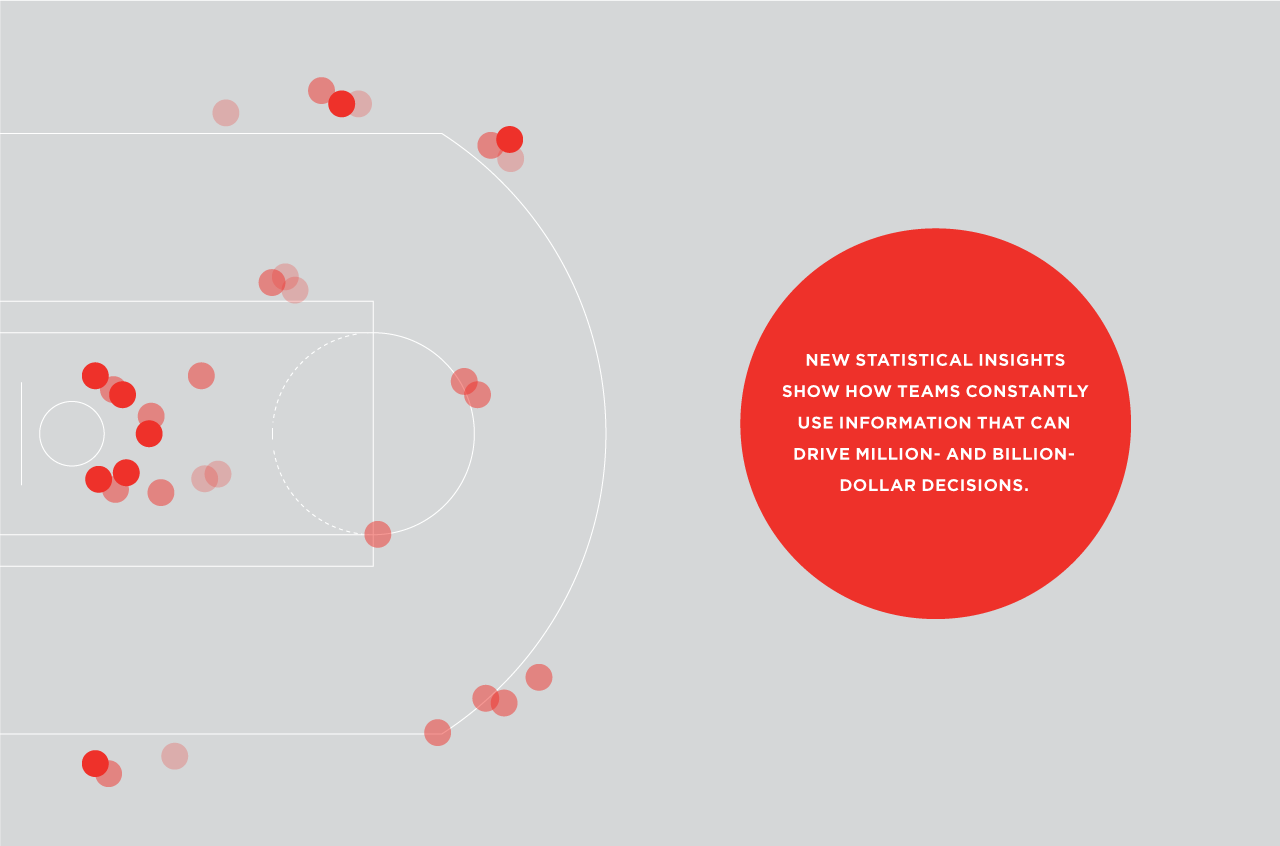
Approach No. 1: Where has the midrange jump shot gone? Or, the use of data to reduce inefficient outcomes
Dunk, three-pointer, dunk, dunk, three-pointer. That’s how it seems the scoring happens in many basketball games today. In a time when basketball is arguably more popular and more exciting than it has ever been, scoring seems to happen from ever-smaller parts of the floor.
LeBron James does whatever he can to shoot either near the rim or from behind the three-point line. Dwight Howard and DeAndre Jordan rarely take a shot from six feet away from the basket. Stephen Curry makes his living from behind (sometimes
well behind) the three-point line.
Even though it may not seem like it, players’ shooting behaviors haven’t always been this way. In 2000-2001, NBA teams attempted 38 percent of their shots from midrange — from 10 feet to just inside the three-point line. Fast forward to today: A little over halfway through the 2014-2015 season, teams are shooting only 28 percent of their shots from midrange and making a similar 40 percent. So where did the other 10 percent go, and why?
Nearly all the shift went to three-point shots. As teams dove into the data, they realized how much more valuable a three-point shot is than a midrange shot. They captured shot locations and field goal percentages for each area of the court. Their insights were eye-opening: A team that shoots 35 percent from three-point range and 40 percent from two-point range (averages that have remained roughly the same in the NBA over the last 15 years) scores, on the average attempt, 31 percent more when they shoot a three-pointer versus a midrange shot.
By tailoring their offensive strategies, teams became more efficient at scoring. Teams that implemented new offenses, reducing the likelihood of midrange jumpers, are the same teams that top the offensive leaderboards today. Golden State, Houston and Atlanta — three of the best teams in the NBA — have fewer midrange attempts compared to the rest
of the league. As businesses consider the data at their disposal, what strategies can they implement to guide them toward more effective decisions and higher efficiency?
Approach No. 2:What is a Paint Protector? Or, the value of using data in a consultative fashion to improve performance
For nearly as long as basketball has existed, players have been cast in one of five positions: point guard, shooting guard, small forward, power forward, and center. Offensive schemes, defensive schemes, development programs, and awards are all tailored to these positions. Draft predictions for players often include statements such as “not big enough to guard the power forward position, not fast enough to guard the small forwards.”
It’s also easier to understand, given that each team has five players on the floor at a time. But players who play the same position often have distinctly different styles. John Wall of Washington is considered a point guard along with Kyrie Irving of Cleveland. However, looking at the differences in their stats and play styles, you’d be hard-pressed to put them in the same category.
In 2012, Muthu Alagappan presented a radical new concept to the Massachusetts Institute of Technology Sloan Sports Analytics Conference and TEDx-Spokane. He used a concept called “topological data analysis” to compare each NBA player across many variables and data points. His analysis showed that there are not only five positions in basketball. There are more like 10 or 13 (he revised an initial set of 13 down to a set of 10).
He found that categorizing players based on their characteristics and how they really play helps teams develop more effective team strategies, personnel decisions, and scouting. In fact, the league’s best teams often have players across all 10 player types; the worst tend to be concentrated in only a few.
Although many businesses don’t have the resources, the need, or even the knowledge to take their data and do topological data analysis, the underlying point is the same. What Muthu did with the data and positions was to craft a solution around the data and the question at hand, rather than fitting a solution around previously prescribed categories, or, as Mathu himself said, we “learned in second grade that doesn’t work very well.” If the data doesn’t seem to fit the story, it may be time to change the story.
Approach No. 3:What can I do to create the best Expected Possession Value (EPV)? Or, the importance of using data to create leading indicators and predictors to set up a team for success
Another addition to the NBA’s analytics arsenal is the SportVU systems now part of every NBA arena. At its core, the system is a set of cameras that track the position of the ball and every player on the floor 25 times per second. When overlaid with play-by-play data from games, the system generates millions of data points, the value of which teams are still unlocking.
One recent insight is the development of Expected Possession Value. As Kirk Goldsberry outlined in his “DataBall” article on Grantland.com, at any given point during a game, there is an expected number of points a possession will produce. That number is based on player locations, player movement, player skill, and a host of other variables. Its core premise, though, is one of simplicity: What actions can each player take to maximize (or in the defense’s case, minimize) the EPV?
The story the data tells is clear. The Los Angeles Clippers’ Chris Paul, long known for being an excellent teammate, is great at setting up teammates in successful positions and had the most positive impact on EPV for the 2012-2013 season. The Minnesota Timberwolves’ Ricky Rubio, criticized often for making poor decisions with the basketball, had the worst impact.
The value of the EPV metric is in what it measures. Box scores and shot charts tend to tell us stories about the results, but they are lagging indicators. EPV, however, acts as a leading indicator. It gives us information about the ways in which players can maximize their chances for success with each and every move they make. Although an organization’s data sets may not always be as rich, the story to tell should be the same: Ensure everyone is being set up with the best chance for success. Don’t just measure the outcomes.
Even though basketball is considered a game, those who are involved at the highest levels understand it to be a business. These new statistical insights show how teams constantly use information that can drive million- and billion-dollar decisions. As the teams are learning to draw ever-improving insights from the data, the NBA is generating revenue at an unbelievable pace. All of the growth may not stem from data-driven insights, but it’s hard to ignore the impact data is having on the basketball world and hard not to think about the possibilities more data-driven analysis could create for the corporate world as well.